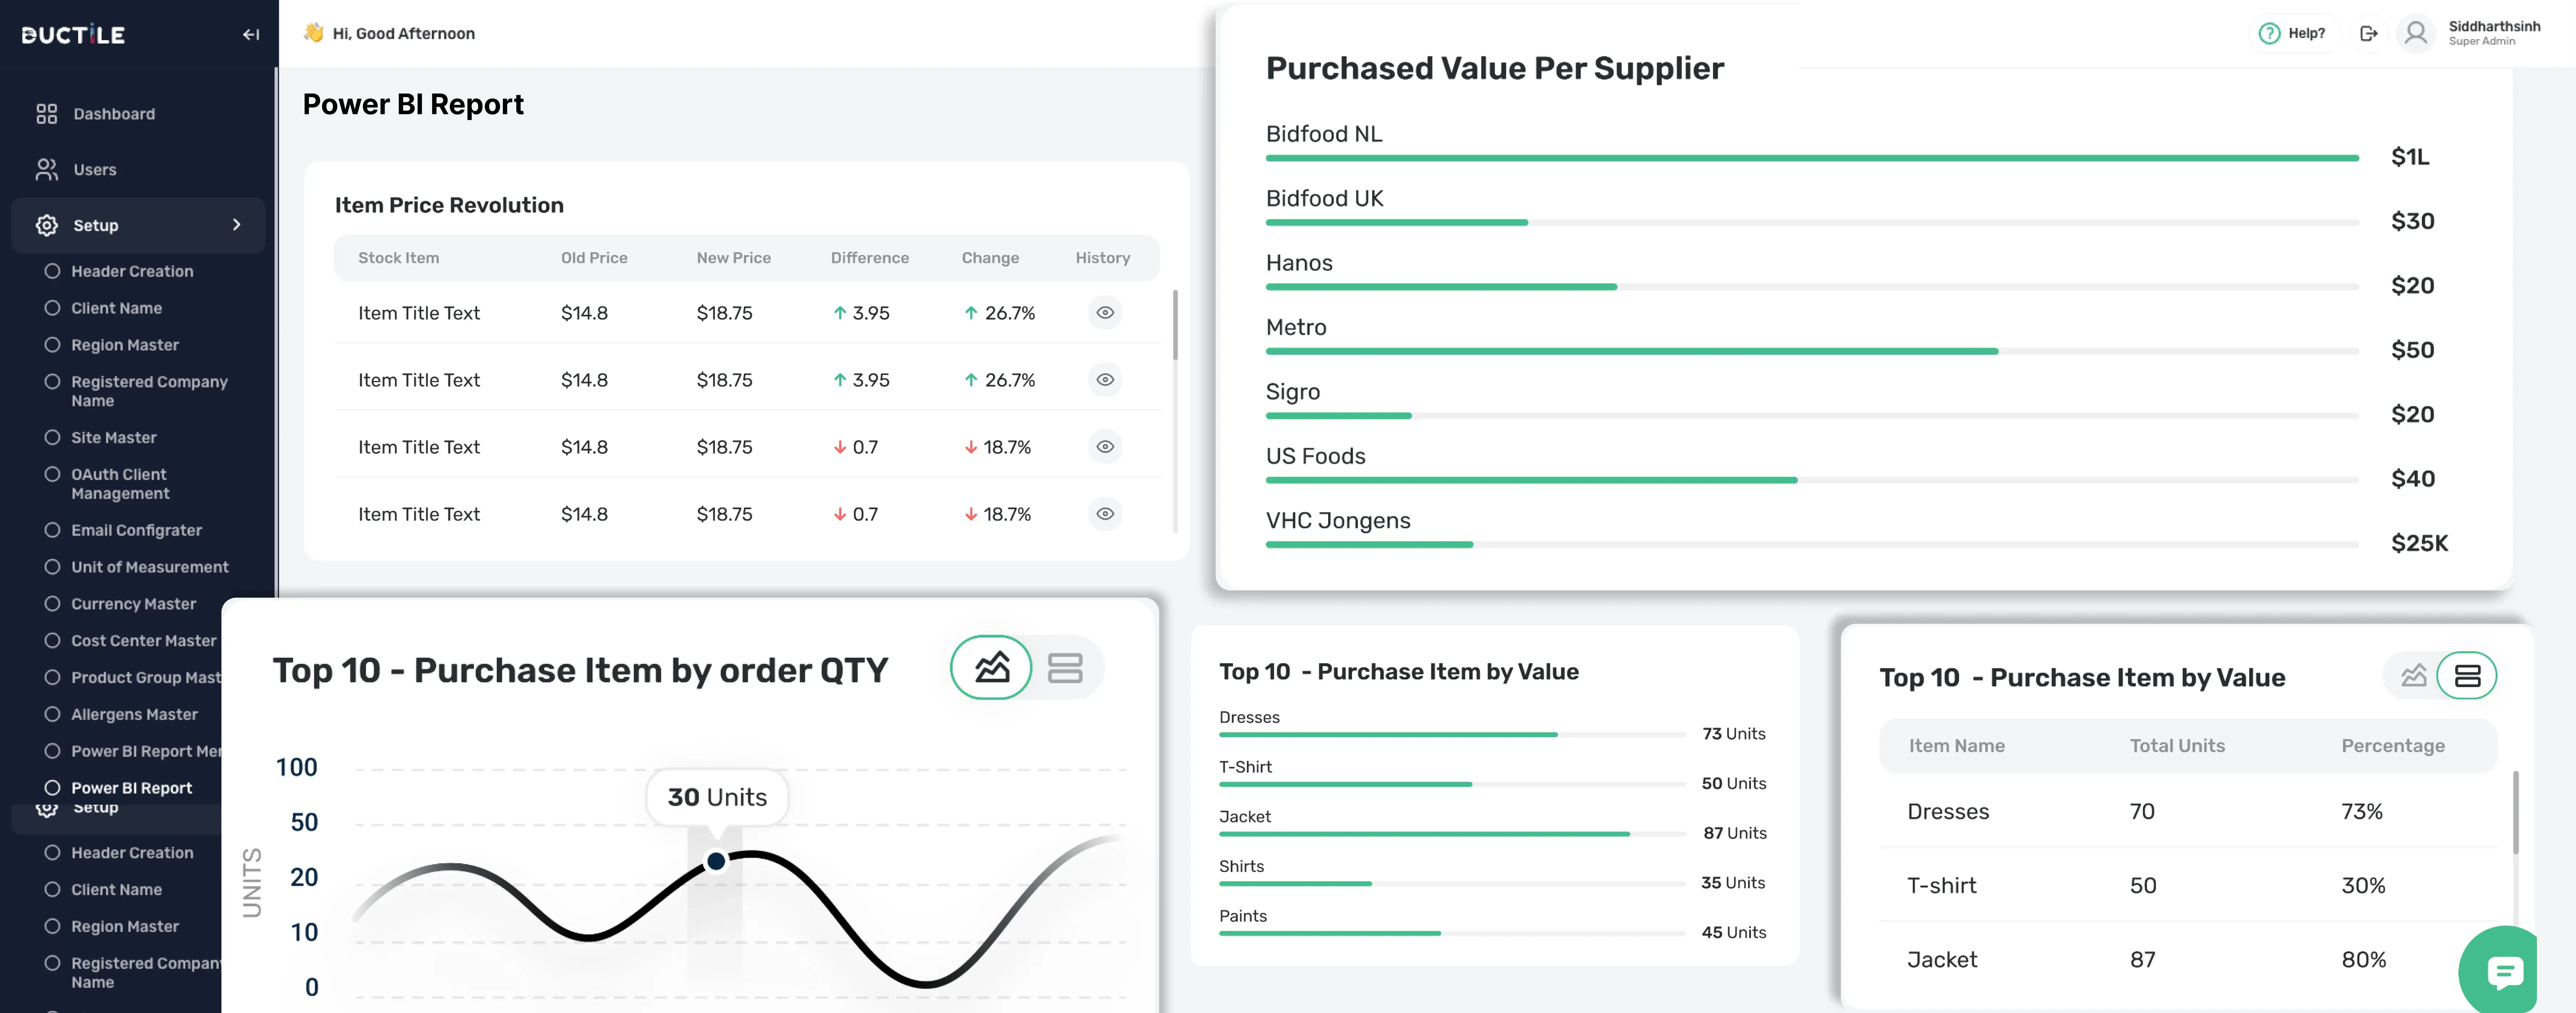
Report Menu Setup - Organizes dashboards into useful groups, so reports are structured around how the business actually uses them
Who Benefits
ManagersFinance leads
Industry
Product
Audience
Purpose
Role-based access ensures sensitive dashboards are visible only to authorized users.
Menu-based reports make it easy to find dashboards relevant to each role.
Leadership gets quicker access to key metrics for confident decisions.
User mapping makes report access assignment consistent and easy to manage.
Challenge
Different users need different reporting views
Navigation
Reports should be easy to find and use
Security
Sensitive data should stay within the right audience
Clarity
Leadership needs a simple way to see the key numbers
Detail
Managers, finance leads, and leadership all need to see different data, but there was no clean way to separate what each role could access
Navigation
Without a clear structure, leaders had to hunt for links or spreadsheets instead of reaching the numbers directly
Security
Reports containing sensitive figures needed protection so they only reached the people who were meant to see them
Clarity
Decision-makers needed a straightforward path to the metrics that mattered, without wading through unrelated reports
What We Built
Groups dashboards in a clear structure organized by menu, rather than leaving reports scattered across links and spreadsheets
User Mapping
Assigns dashboard access based on role or need, so each person's reporting menu reflects exactly what's relevant to them
Embedded Visibility
Makes the reporting experience feel natural by embedding dashboards directly into the platform rather than routing users elsewhere
Why It Matters
Leaders reach the numbers they need without hunting, because reports are organized in a way that matches how the business actually works
User Mapping
Sensitive data stays within the right audience, and every user's experience feels tailored rather than generic
Embedded Visibility
Reporting becomes part of the daily workflow instead of a separate destination people have to remember to visit
Report Menu Setup - Organizes dashboards into useful groups, so reports are structured around how the business actually uses them
User Mapping - Assigns the right reports to the right people, giving each user a reporting menu that matches their role
Embedded Analytics - Keeps reporting accessible in a familiar layout, embedded directly into the platform rather than a separate tool
Governed Access - Protects sensitive dashboards, ensuring only the intended audience can view reports containing sensitive figures
Backend


Frontend / Templating
Analytics & Reporting
User Management
Security & Access
Direct Access to Key Metrics
Leaders can reach the numbers they need directly, without hunting for links or spreadsheets
Secure Dashboard Access
Role-based access ensures sensitive dashboards are only seen by the people who should see them
Easy Report Navigation
Reports are organized by menu, making it simple for users to find the dashboard relevant to their role
Faster Decision-Making
Leadership reaches key numbers more quickly, supporting faster, more confident decision-making
Faster Decision-Making
Managing who has access to which reports is simpler, with user mapping handling assignment consistently
Optimize your cloud infrastructure, implement robust solutions, and stay ahead of trends with our resource hub.
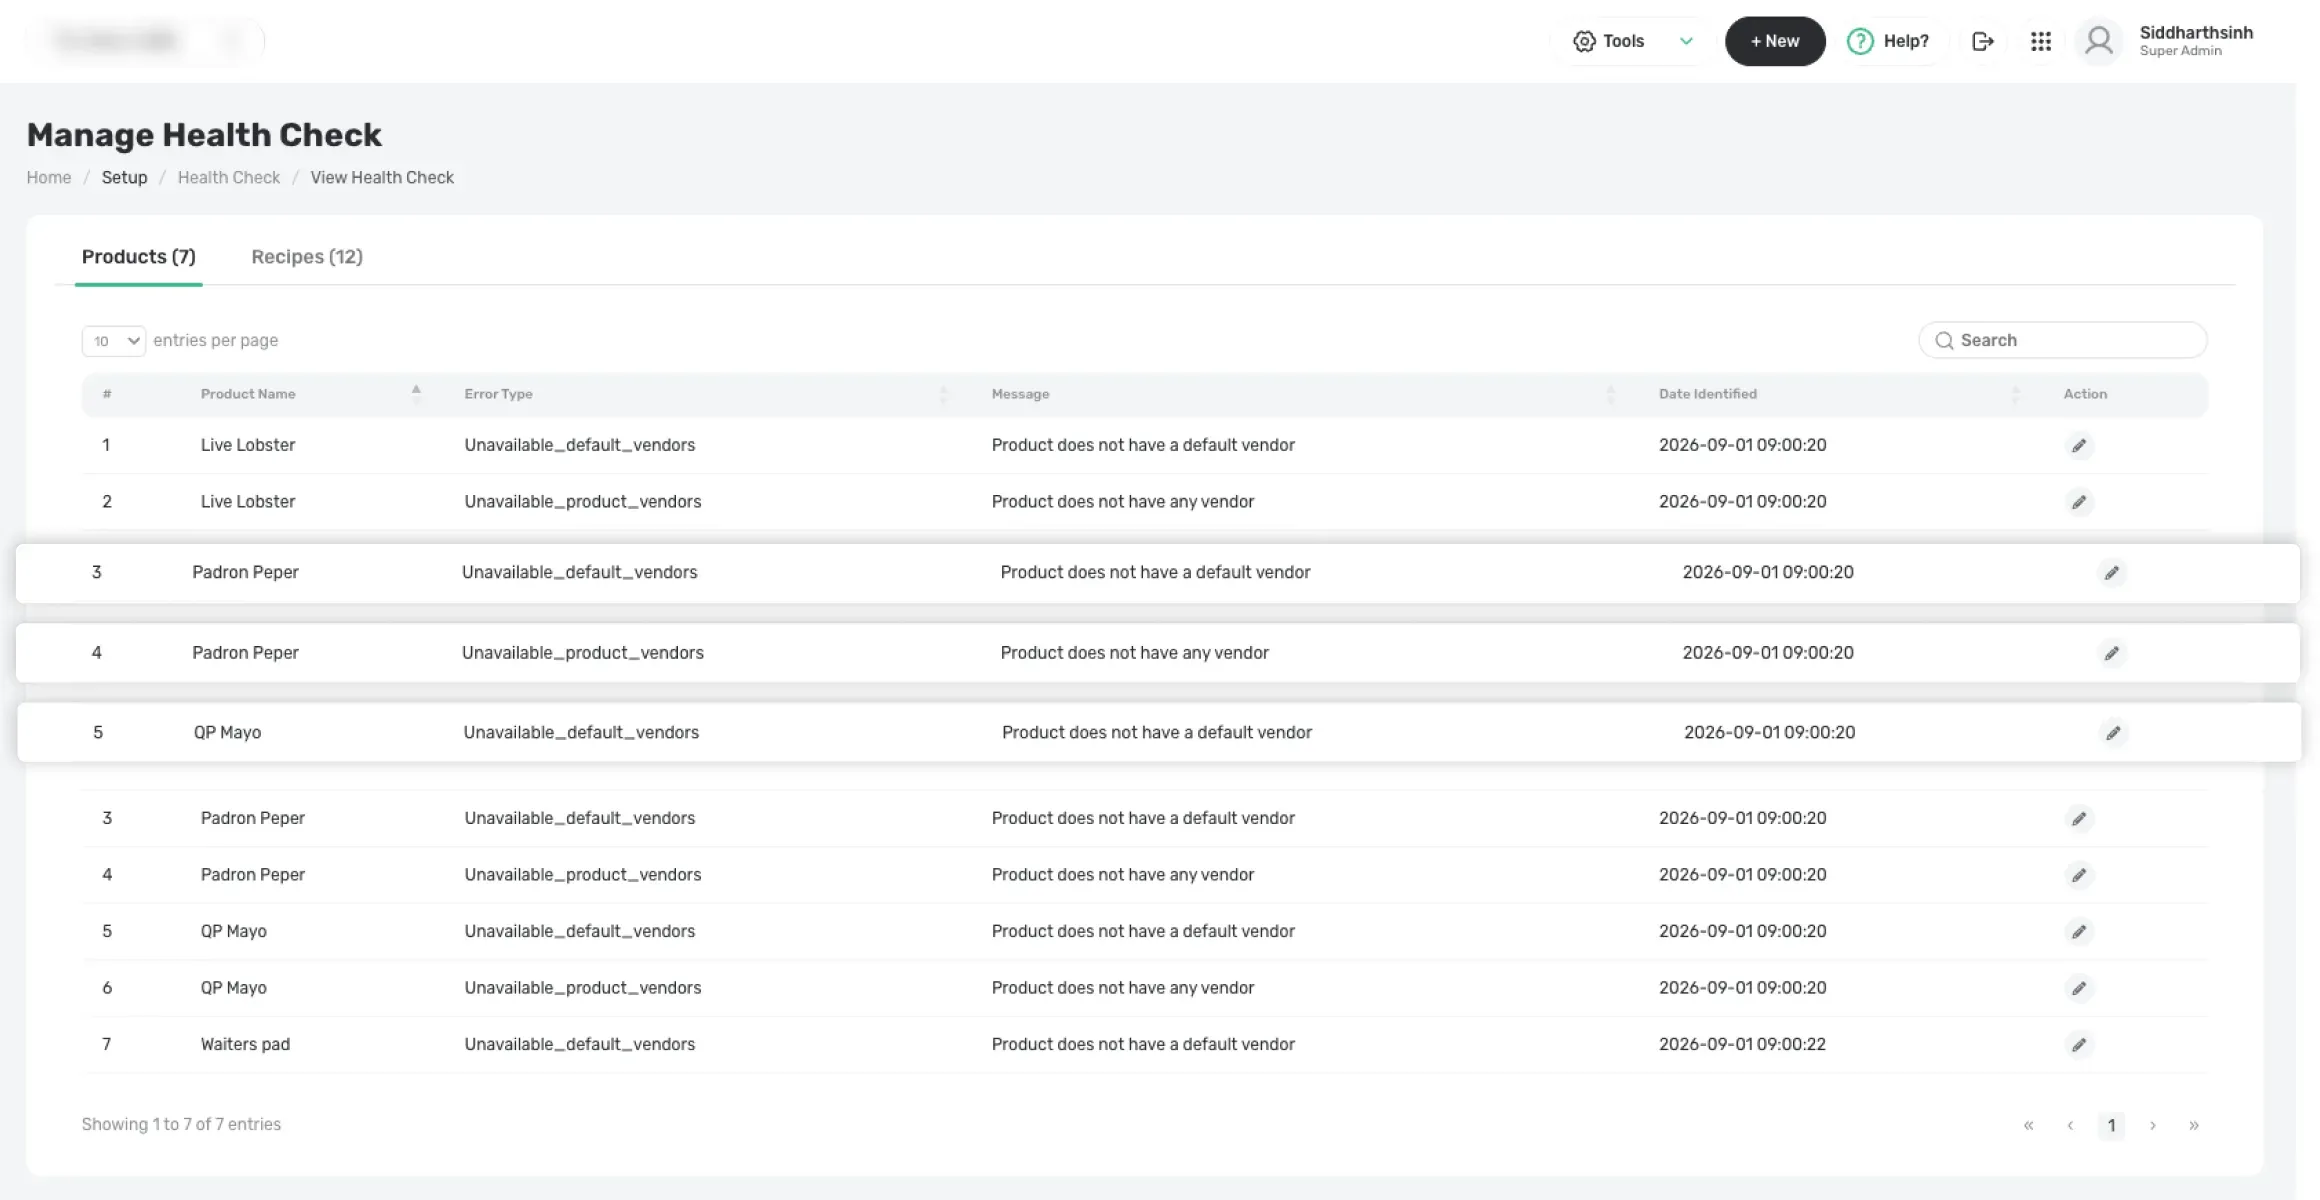
Explore a restaurant product and recipe data platform designed to centralize product information, manage recipes, and improve operational data consistency.
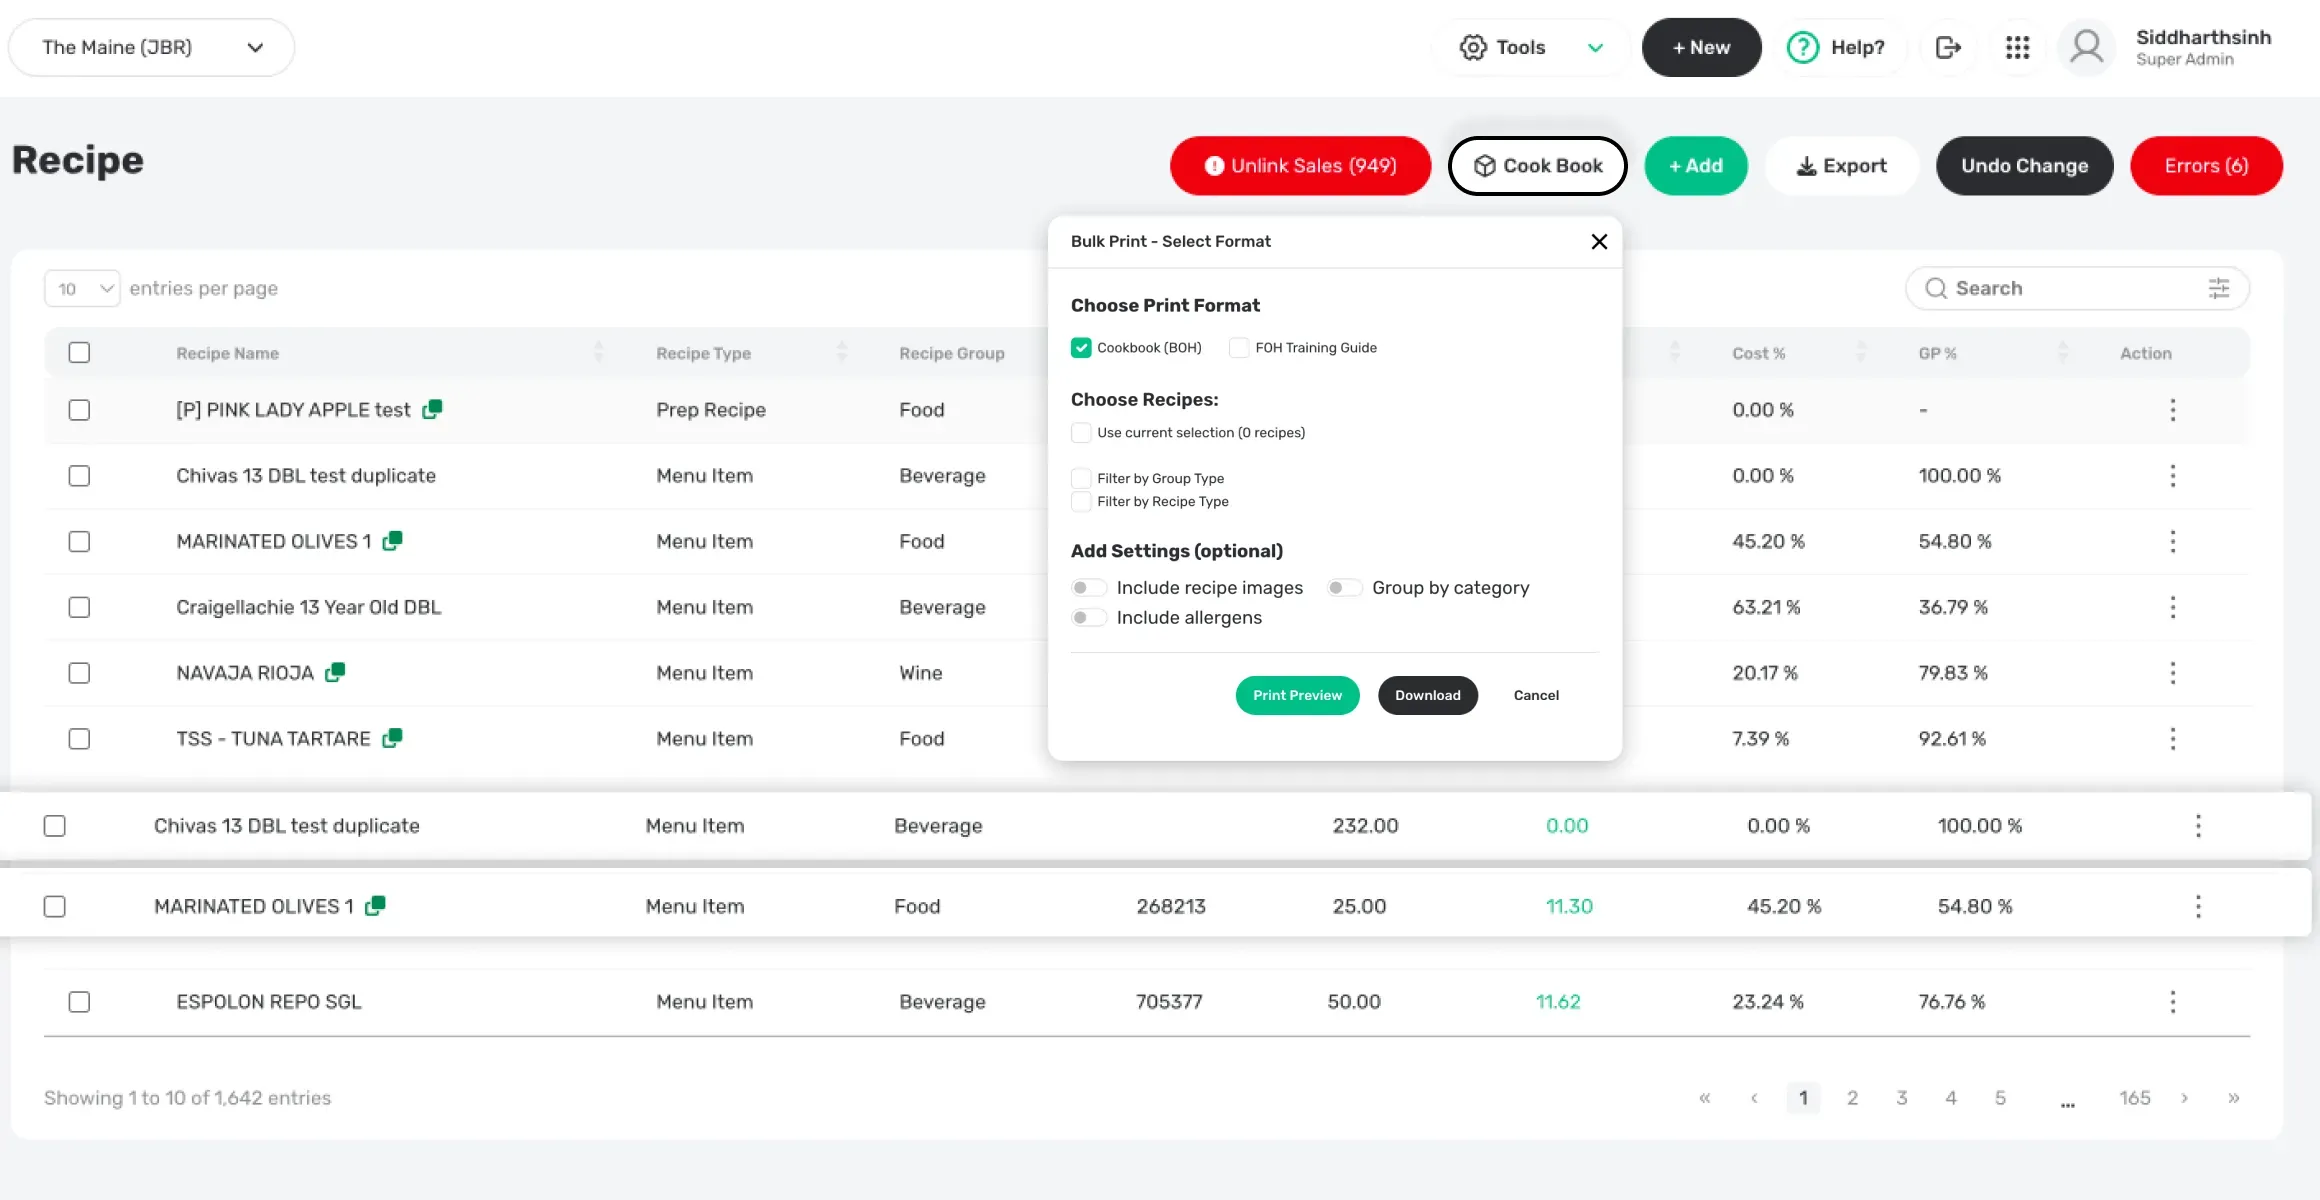
Discover how recipe and menu control solutions help kitchens manage recipes, standardize menus, and maintain consistent food operations across locations.
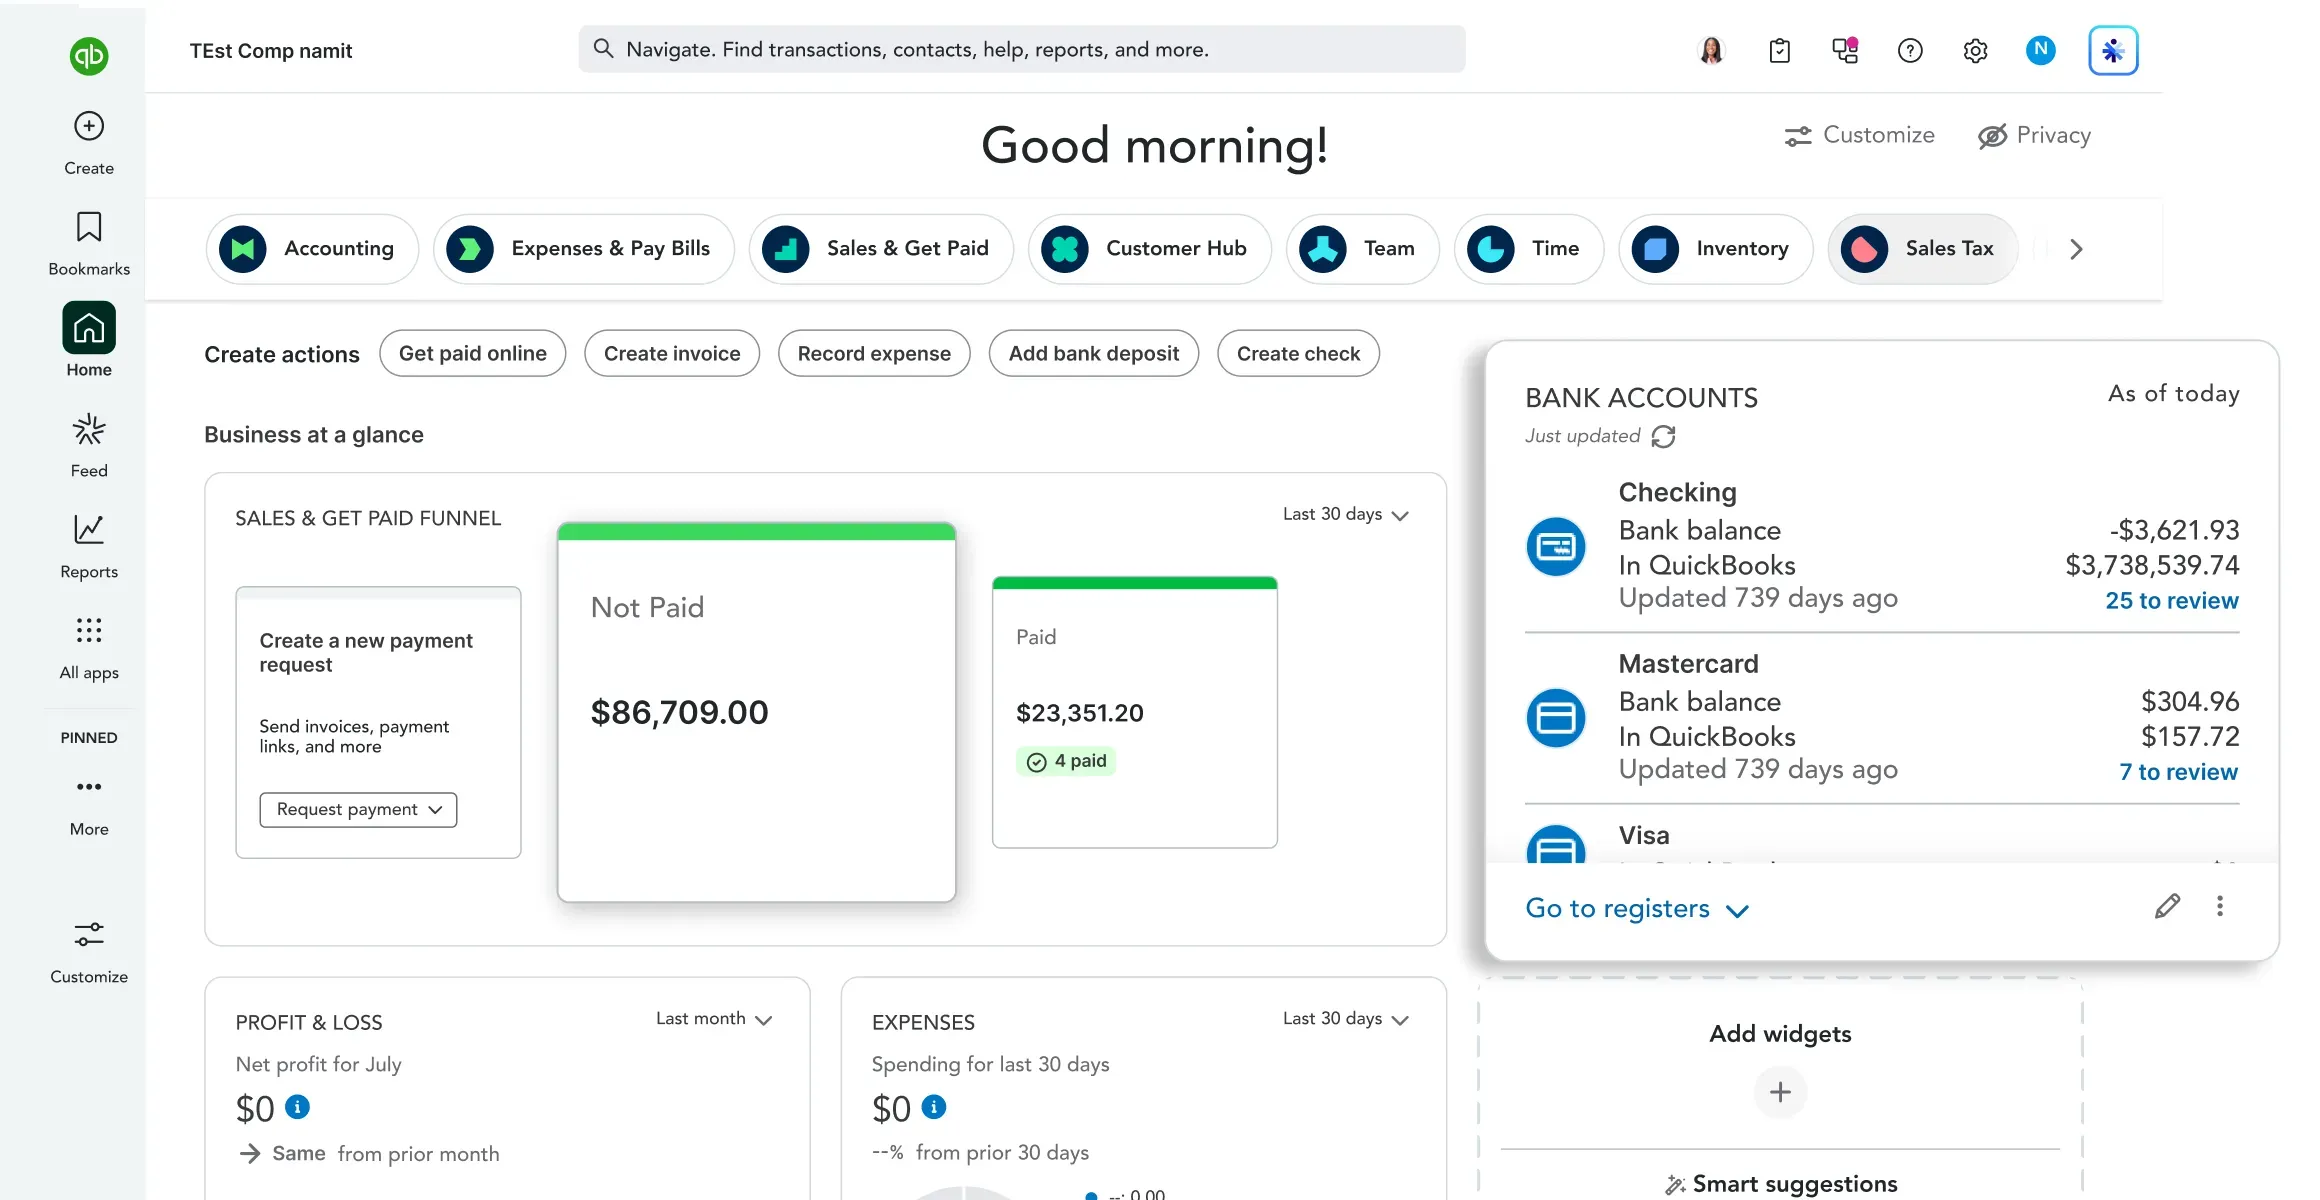
Discover how QuickBooks Online integration streamlines restaurant finance, automates accounting workflows, improves reconciliation, and provides better financial visibility.
Join 100+ teams scaling with Cinovic. Fill out the form below to get personalised tour of the platform.
Restaurant and hospitality reporting provides leaders with clear insights into business performance, operations, sales, and key performance indicators to support better decision-making.
Reporting helps leaders monitor performance, identify operational trends, understand business results, and make informed decisions based on data.
Restaurant reporting can track metrics such as sales performance, revenue, operational performance, customer activity, and other business KPIs.
Yes. Reporting solutions can bring data from different business systems into a centralized view, making it easier for restaurant and hospitality leaders to analyze performance.
By providing timely and organized business insights, reporting enables leaders to identify trends, compare performance, and make data-driven operational and strategic decisions.